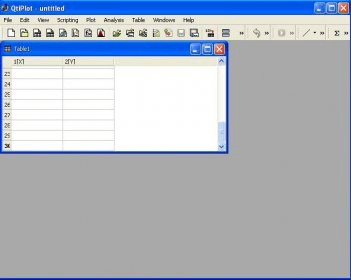
QtiPlot is a program for two- and three-dimensional graphical presentation of data sets and for data analysis. Plots can be produced from data sets stored in tables or from analytical functions.
- Cross-platform: works natively on Windows, Mac OS X and Linux/Unix systems
- Fully Python scriptable
- OpenGL based 3D plotting
- Publication quality plots and easy export to various image formats (EMF, EPS, PS, PDF, SVG, BMP, JPG, PNG, TIFF, etc ...)
- Easy integration with LaTeX typesetting system
- Powerful and versatile spreadsheets with column-logic calculations and easy import/export of multiple files
- One-click access to extensive built-in data analysis routines
- Advanced statistical analysis: Student's t-Test, ANOVA, chi-square test for variance, normality test (Shapiro-Wilk)
- Linear and nonlinear curve fitting with weighting and estimation of statistical errors of the fit-parameters
- Multi-peak fitting
- Image analysis tools
- Templates support: all settings for plots, tables and matrices can be saved and restored later on for a fast editing process
- Project files based on folders, a powerful project explorer with built-in drag and drop and searching facilities
- Full import of OriginLab® Origin projects, Excel workbooks and Open Document Format spreadsheets
Comments (1)